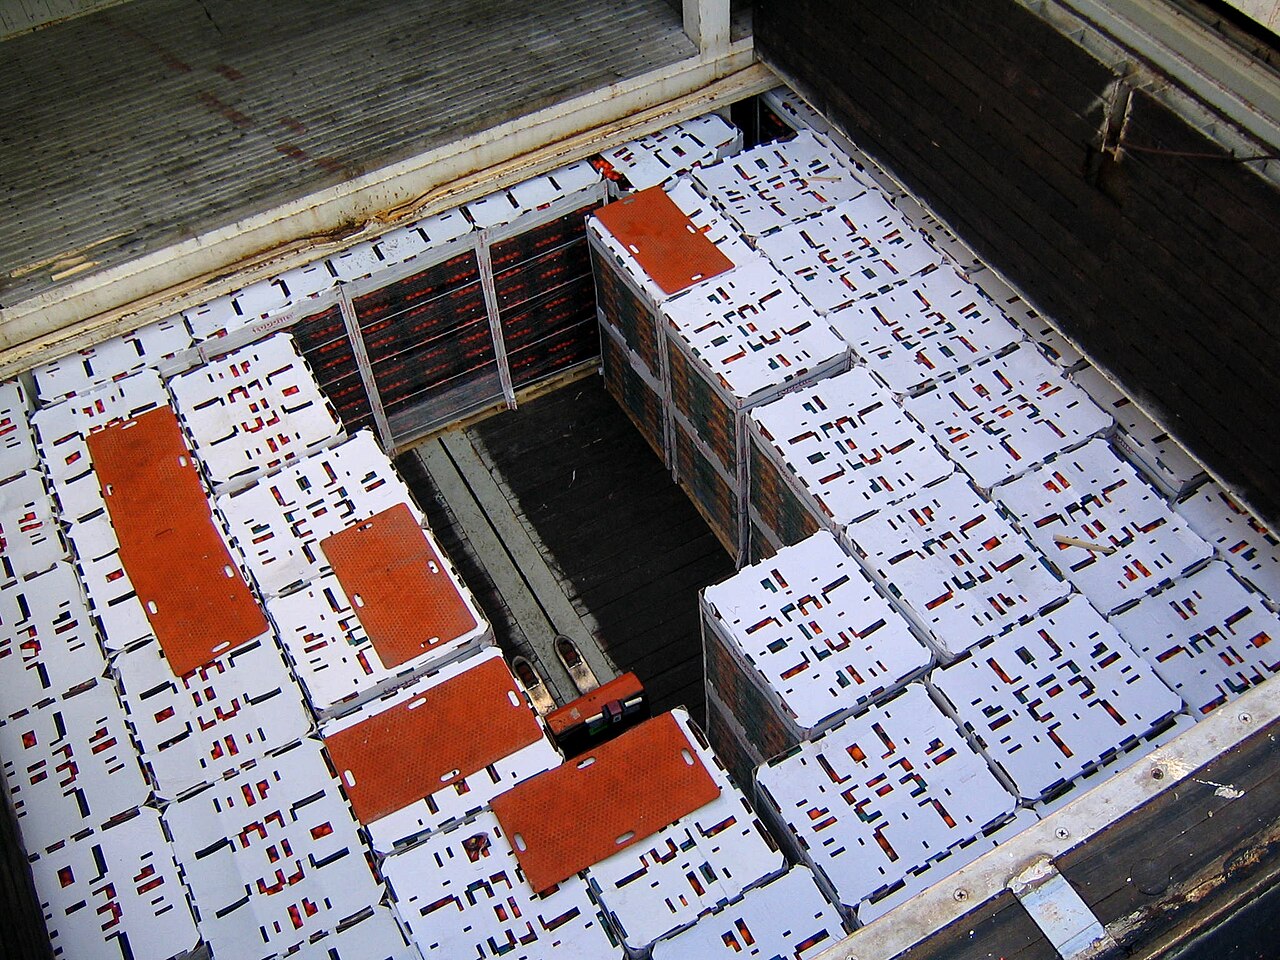
Temperature-sensitive goods change hands
Cold chain risk appears at loading, cross-dock, customs, last mile, and receiving handoffs.
Solution / Cold chain temperature monitoring
Logmore turns cold chain logger data into cloud shipment reports so teams can review excursions, share evidence, and improve lanes without chasing local files.
When this matters
Cold chain risk appears at loading, cross-dock, customs, last mile, and receiving handoffs.
Reports help suppliers, carriers, and customers discuss what happened without relying only on manual notes.
Cloud dashboards make recurring temperature issues easier to spot across routes, partners, and products.
How Logmore helps
Logmore connects physical shipment monitoring with reviewable cloud records so QA, logistics, and partners can work from the same evidence.
QR scans help teams collect temperature data from warehouses, depots, vehicles, and receivers without new field hardware.
Reports, alerts, and exports stay in one workspace so quality and logistics teams can review the same record.
Use Logmore across pharma, food, chemicals, samples, and other temperature-sensitive shipments.
Recommended setup
The right setup depends on product risk, return logistics, sensor needs, and the evidence your team needs after the shipment arrives.
Separate regulated products, food quality lanes, frozen loads, and high-value specialty shipments before choosing logger models or alert thresholds.
Use scans at loading, cross-dock, receiving, QA review, or customer handoff so evidence appears where operational decisions happen.
Review excursions by route, carrier, location, product group, or receiving site to identify repeat cold chain problems.
Handoffs
Cold-chain monitoring matters most when products change hands and teams need evidence for acceptance, claims, and lane improvement.
Use temperature graphs and scan timing to discuss whether an issue happened before delivery, during handoff, or after receiving.
Scan at loading, cross-dock, customs, last mile, or receiving when that point affects acceptance or review.
Use the same QR-to-cloud pattern for pharma, food, samples, chemicals, and specialty logistics with different thresholds and reports.
Scenarios and evidence
Focus on certificates, audit trails, controlled reports, and QA release evidence for regulated products.
Focus on customer acceptance, rejection prevention, waste reduction, supplier quality, and carrier follow-up.
Add humidity, shock, light, or probe data when temperature alone does not explain shipment risk.
Workflow
Keep the monitoring process clear enough for warehouses, receivers, QA teams, and partners to repeat.
Set logger type, measurement interval, thresholds, product profile, and reporting rules before dispatch.
The QR data logger records condition history while the shipment moves through carriers, handoffs, dwell time, and receiving.
A normal phone scan uploads data to Logmore Cloud without USB readers, installed receiver apps, or local report files.
Quality and logistics teams review reports, alerts, audit trails, certificates, comments, and exports from one cloud record.
Common objections
Temperature is the core signal, but humidity, shock, light, scan location, and handoff context can matter depending on the product.
Logger-based evidence fits many lanes. Use live trackers when the team must intervene before the shipment arrives.
Product context
Logger models for temperature, humidity, shock, light, and dry ice lanes.
Open pageCloud reports, dashboards, alerts, audit trails, certificates, comments, and exports.
Open pageConnect mission data to quality, logistics, WMS, TMS, and control-tower systems.
Open pageIndustry overview for regulated pharma, life science, vaccine, sample, and clinical trial shipments.
Open pageIndustry overview for chilled, frozen, and ambient food distribution.
Open pageFAQ
It is the use of sensors, loggers, reports, and review processes to confirm that temperature-sensitive goods stayed inside the required range during transport or storage.
Common industries include pharmaceuticals, life sciences, food distribution, specialty chemicals, healthcare, and other supply chains where temperature affects safety or quality.
Yes. QR data loggers record during the journey and upload data when scanned. This fits lanes where full real-time tracking is not required or would add unnecessary cost.
A useful report should show temperature history, threshold rules, excursions, scan events, timestamps, logger identity, and exportable evidence for review.
Thresholds should follow product requirements, quality procedures, lane risk, and any customer or regulatory expectations.
Yes. Repeated report and dashboard review can reveal recurring dwell-time, handoff, route, or carrier issues.
Related pages
Map which routes need QR data loggers, Cloud reports, live intervention, or deeper product-specific workflows.